
LotLens Studio — Research · Architecture · Planning · Spatial data
US ± Europe ± Asia
Research, Data & Tools for Land and Buildings.
LotLens is a studio of licensed architects, planners and researchers — with our own apps. We turn parcel, zoning and building data into clear answers for current and future homeowners, builders, investors and cities.
Early access Our apps open to people one by one: ask with your email
Imagery © Esri, Maxar · swisstopo · data shown is illustrative
The LotLens apps
Tools from our studio, for everyone.
Our methods, packaged as apps. The Lot Report and LotLens Model (United States) and LotLens Massing (Germany, Austria and Switzerland) are open in early access: ask with your email and we let you in. Synth is in development. Each card shows who it’s built for.
-
 Early access
LotLens Lot Report
United States
For Homeowners · Real-estate agents · Investors
Everything about your home or lot in one clear report: what you own, how home values in your area have moved and what the zoning rules allow, each rule with its source.
-
 Early access
LotLens Massing
Germany · Austria · Switzerland
For Homeowners · Real-estate agents · Investors · Architects
Turns land and building data into searchable values and calculates the maximum buildable volume and floor area under local ordinances. Hidden potential for builders, agents, architects and investors, and a planning tool for cities.
-
 Coming soon
LotLens Synth
US · Global
For Cities · Governments · Institutions · Real-estate agents
Parses and synthesizes codes, plans and datasets into the information planners, designers and builders actually need.
-
 Early access
LotLens Model
United States
For Everyone: homeowners, students, communities, design reviews
Turn your house into a paper model: a kit to print, cut, fold and glue, with the roof measured from lidar and the windows from street imagery. Files for cutting machines too.


For Homeowners · Home buyers · Families · Real-estate agents · Investors
Know what your lot allows, and what it could become.
Enter your address and get a clear, visual report: what you are allowed to build, how home values in your area have moved and which opportunities are hiding in the zoning code. Prepared with the same methods our architects use on professional projects, explained without the jargon.
- Zoning & allowed uses
- Setbacks & the zoning envelope
- ADU & expansion potential
- FEMA flood zone
- Neighborhood map: schools, parks, childcare & stores
- Walkability & home values
Every rule in a report names its source, and a quote from the city’s code is checked on the page it came from. How that works, and how it is measured: how the rules are read and checked →
Sample report · free, no sign-up
See exactly what you get.
A complete Lot Report for a fictional property, laid out the way you will receive yours: every table, drawing and figure, and the written part.
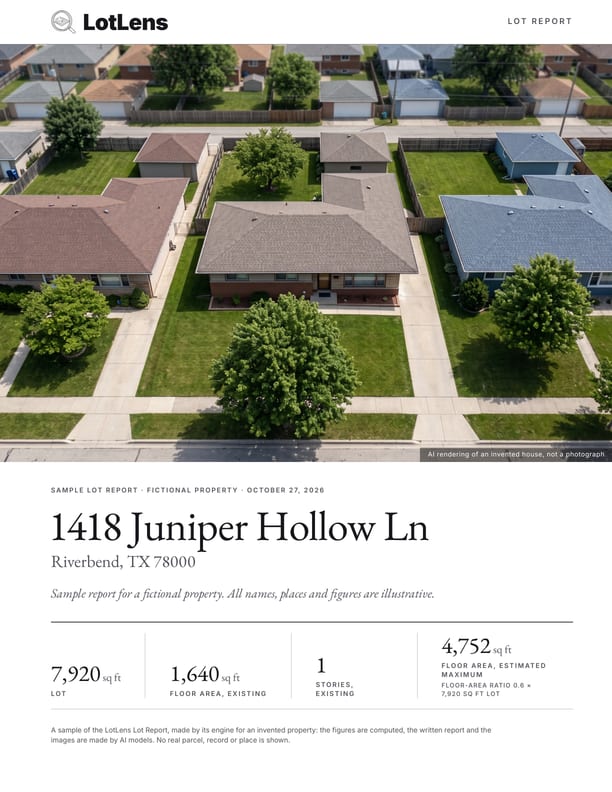
Cover
Address, an AI bird's-eye view and the key numbers at a glance
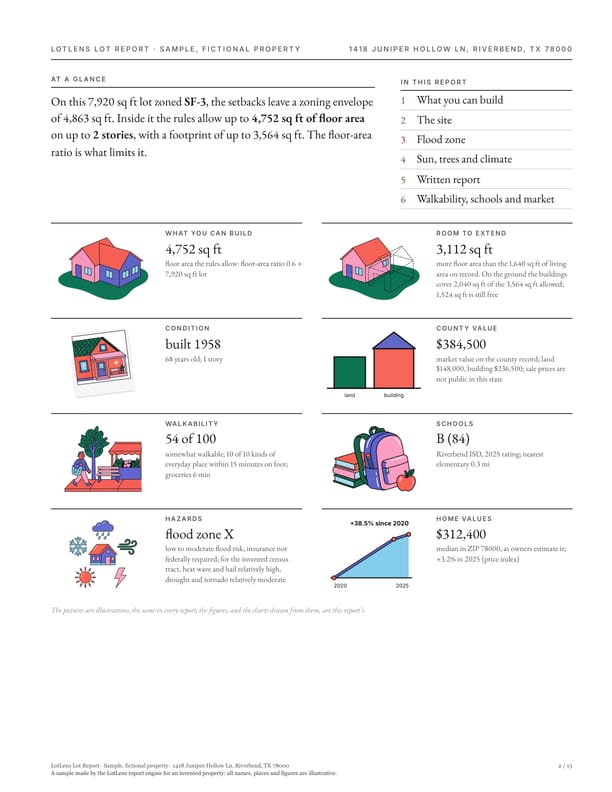
At a glance
The verdict, then eight answers with pictures: what you can build, room to extend, hazards, home values and more
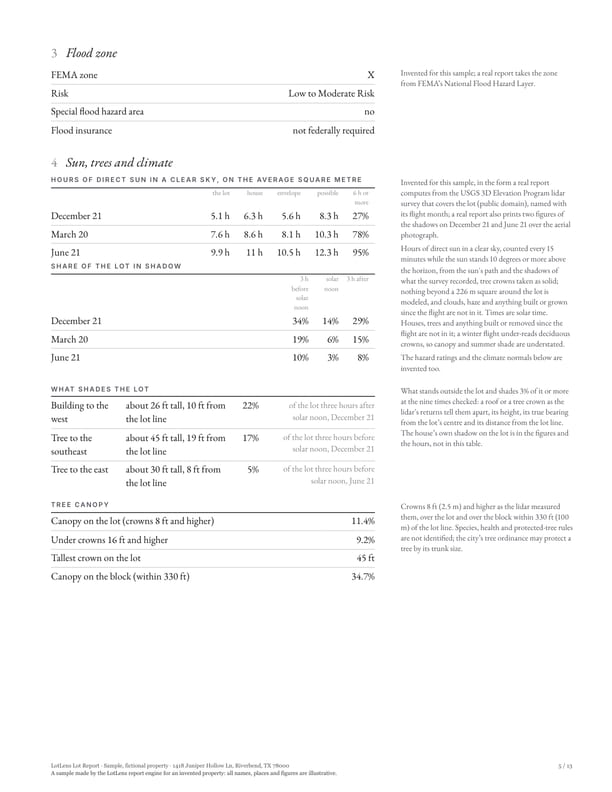
Flood zone, sun & trees
The FEMA flood zone, then sun, shade and the tree canopy from public lidar
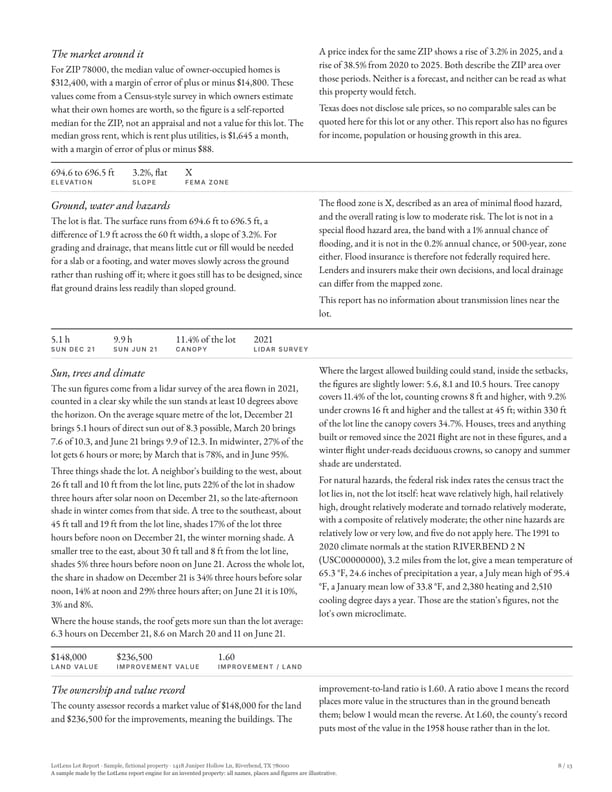
Written report
The written part: the market, the ground, sun and trees, the record, each figure checked against the tables


Sample report for a fictional property. All names, places and figures are illustrative.
For Homeowners · Real-estate agents · Investors · Architects
The maximum buildable volume, straight from the local plan.
LotLens Massing reads development plans (Bebauungspläne), zoning maps and building data across Germany, Austria and Switzerland, and turns them into searchable values: maximum volume, floor area and storeys for every parcel. Hidden potential becomes visible for builders, agents, architects and investors, and cities get a clear picture to plan the future.
- Site coverage (GRZ)
- 0.4
- Floor area ratio (GFZ)
- 1.2
- Full storeys (Vollgeschosse)
- III
- Max. building volume (BRI)
- 6,480 m³

Fig. 03 · What you get
Every parcel, measured against its plan.
From the development plan (Bebauungsplan) to a 3D envelope in seconds: the parcel, the building line (Baugrenze) and the largest volume the plan allows — ready for feasibility, valuation or a council meeting.
- Max. floor area & volume
- per parcel, in m² and m³
- Unused potential
- allowed minus built today
- Searchable
- filter a whole municipality by potential
- Plan rules, explained
- GRZ, GFZ, storeys, heights, building lines
- Exports
- PDF report · 3D model · data table

Fig. 07 · How it works
Six layers of data. One searchable answer.
LotLens Massing stacks what normally lives in separate offices and formats, and reads it the way an architect would. Our own models link the layers parcel by parcel, so the result is consistent across a whole city.
- 01Orthophotowhat is on the ground today
- 02Cadastreparcel boundaries & ownership units
- 03Development plan (Bebauungsplan)zones, building lines, GRZ / GFZ, heights
- 04Terrain (DTM)slope and ground height
- 05Buildings in 3Dexisting volumes, LOD 2
- 06Resultmax. buildable volume & unused potential

- Builders & developersFind sites with unused potential
- Real estate agentsShow buyers what a parcel allows
- ArchitectsStart design from the legal envelope
- InvestorsCompare potential across portfolios
- Cities & municipalitiesPlan growth and test plan changes
For Everyone: homeowners, students, communities, design reviews
Print it. Fold it. See your house on the table.
Turn your house into a paper model. LotLens Model measures the roof from lidar, reads windows and doors from street imagery and lays it all out as a kit to print, cut, fold and glue: Letter, Tabloid, A4 or A3, at 1:50, 1:100, 1:200 or 1:500, or at the US scales 1/4″, 1/8″ and 1/16″ to the foot and 1″ = 40′, ready in a minute or two. Every kit brings its own instructions: a page of the pieces and their joints, a page on how to build it, then the sheets to cut, with a ruler to check the print. A simple way to understand space, for families, students and community meetings.

Or print it in 3D — with the real landscape.
Download a print-ready file of your parcel with the real terrain: slope, contours and the neighbouring buildings, with your house or your planned addition highlighted. Print it at home, at a library or with a print service.
- Formats
- PDF net (Letter / A4) · STL · 3MF · OBJ
- Scales
- 1:200 · 1:500 · 1:1000
- Includes
- terrain & slope · contours · neighbours · zoning envelope
- Made for
- families · schools · design reviews · community meetings

Who we are
A studio first. The apps come from our practice.
Every LotLens app is built on decades of real projects and funded research. Licensed architects, planners and data scientists stand behind every number we show you.
60+ yrs
Professional practice
Combined experience across the AEC industry: architecture, engineering and construction, in every project phase and at every scale.
3
Continents
Licensed architects with built work and practice in the US, Europe and Asia.
30+ yrs
Research
Combined research at academic and private institutions across the US and Europe.
Funded
High-tier research
Research funded by federal agencies and the private sector.
- Scales
- Region
- City
- District
- Site
- Building
- Interior
- Element
- Phases
- Research
- Concept
- Design
- Permitting
- Construction
- Operation
- Life-cycle assessment
- Post-occupancy evaluation
What we do
One studio, from a single lot to a whole city.
Use an app on your own, or bring us in. Our services cover the full path from data to decision to design. Each one names who it’s for, so you can find your starting point.
01 ± App · Early access
Lot Report
For Homeowners (current & future) · Real-estate agents · Builders
Plain-language reports for a US home or lot: zoning, setbacks, the zoning envelope, flood risk and what the rules allow, every number with its source.
02 ± App · Early access
Development plan massing · DACH
For Homeowners · Real-estate agents · Investors · Cities · Communities
Maximum buildable volume and floor area from local development plans (Bebauungsplan) in Germany, Austria and Switzerland.
03 ± Service
Spatial & data intelligence
For Cities · Investors · Real-estate agents · Institutions
GIS, parcel and building data turned into decisions: site selection, feasibility and portfolio analysis.
04 ± Service
Proprietary AI & ML
For Institutions · Cities · Governments · Researchers
Custom models we design and train ourselves, for problems off-the-shelf tools cannot solve.
05 ± Service
Multi-modal data synthesis
For Cities · Governments · Investors · Real-estate agents · Institutions · Researchers
Imagery, plans, codes, records and sensor data combined across platforms into custom results, not generic data streams.
06 ± Service
Partner for cities & governments
For Cities · Governments · Communities
Streamlined processes, evidence-based policy making and clearer community engagement.
LotLens Studio
Work with our studio.
Research and real-estate architecture consultancy, grounded in data. We partner with cities, governments, developers and communities to streamline processes, shape policy and bring people into the conversation, in the US, Europe and Asia.
Proprietary AI & ML
We build and own our AI and machine-learning systems: custom models trained on our own spatial, planning and building data. Nobody else has them. They power the LotLens apps, and we tailor them to your project, your city or your portfolio.
- Cities & governments
- Permitting · policy · engagement
- Developers & investors
- Feasibility · site selection
- Architects & planners
- Massing · codes · data
- Research partners
- Funded studies · AI & ML
